OSMatrix was a browser-based application that visualised progress and quality metrics of OpenStreetMap’s data throughout Europe.
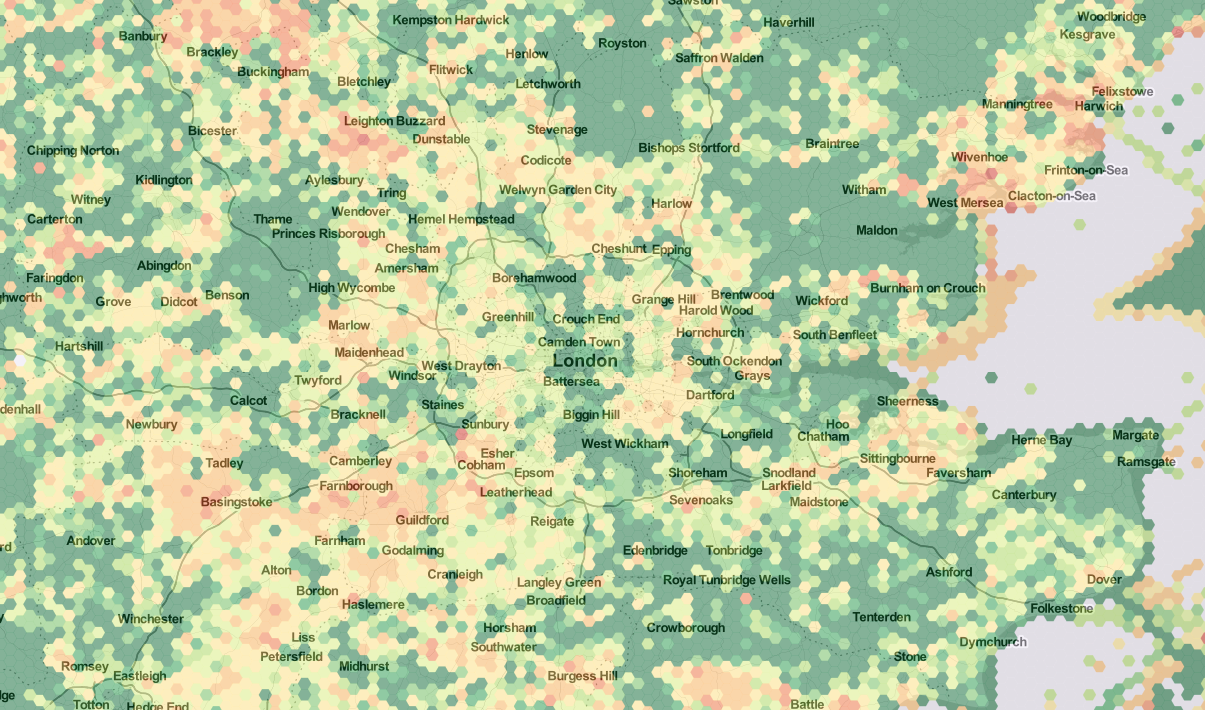
We divided the area into hexagonal cells, and for each cell, we calculated a set of numbers about data contributed to OpenStreetMap in the area. The indicators include user behaviour (number of objects modified per user, number of contributing users), topicality of data (version numbers and timestamps of the mapped objects), relative completeness (number of features and number of attributes) or aggregated numbers of several feature types (area covered by buildings, farmland, commercial, residential and industrial areas).
All indicators were stored in a Postgres database. To visualise the data on the web, we implemented a custom backend in NodeJS that generated map tiles on the fly and provided an API to query indicator values at different time stamps. We visualised the map tiles in a browser application using LeaflefJS and used temporal data to generate charts illustrating the development of individual parameters over time.
OSMatix has since been succeeded by the OSM History Explorer.